Python Debugging with pdb
This video explains how you can debug a Python applications with pdb,the Python debugger. [youtube bZZTeKPRSLQ] Video Source: http://marakana.com/forums/python/python/423.html
This video explains how you can debug a Python applications with pdb,the Python debugger. [youtube bZZTeKPRSLQ] Video Source: http://marakana.com/forums/python/python/423.html
Ruby might be slow, but bad code only makes it worse. This video teaches you how to use powerful tools to see how your code is executed, so you can understand, debug and optimize it. It covers techniques that can be used to troubleshoot production ruby deployments from three perspectives: …
YUI engineer Luke Smith discusses the fine art of debugging web applications, looking at general tools and techniques and providing a few specific hints about debugging in YUI 3.
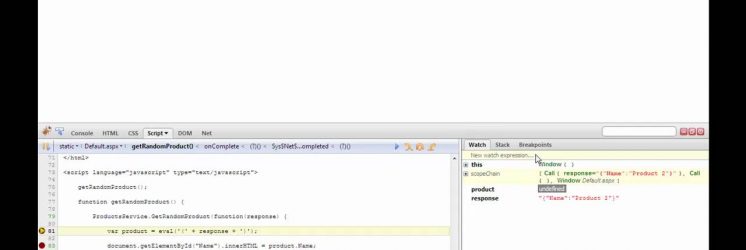
A short introduction to the usage of Firebug, a Firefox add-on, to debug JavaScript code. Firebug integrates with Firefox to put a wealth of web development tools at your fingertips while you browse. You can edit, debug, and monitor CSS, HTML, and JavaScript live in any web page. [youtube dV67cXhWeIo]
There are many ways to create breakpoints. By default, a breakpoint is triggered each time a line of code is reached. This video demonstrates how to use advanced breakpoints to only trigger when certain conditions are met. http://msdn.microsoft.com/en-gb/vstudio/dd442440.aspx
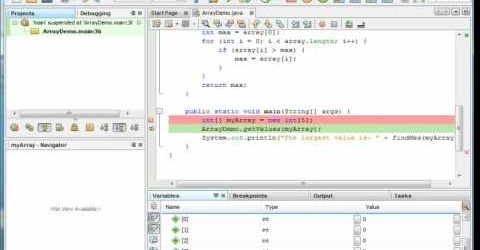
An introduction to using the NetBeans debugger [youtube joWldbcp1So]